
Connect Dashboard overview
The Connect Dashboard enables you to track the health of your Docusign Connect configurations by aggregating and displaying data about their event notifications. The Connect Dashboard provides a graphical timeline of your successful and failed event notifications for a given configuration, and a log of the specific event notifications generated by a configuration.
The Connect Dashboard shows metrics for all of the Connect event notifications generated by all of your account’s Connect configurations, including account- and envelope-level configurations as well as Recipient Connect configurations. The Dashboard shows all of your Connect event notifications, regardless of event format; both Legacy event message formats (Connect 1.0) and JSON SIM event model (Connect 2.0) are supported.
Accessing the Connect Dashboard
The Connect Dashboard is available in both the developer (demo) account and production environments using these links:
- Developer environment
- Production environment
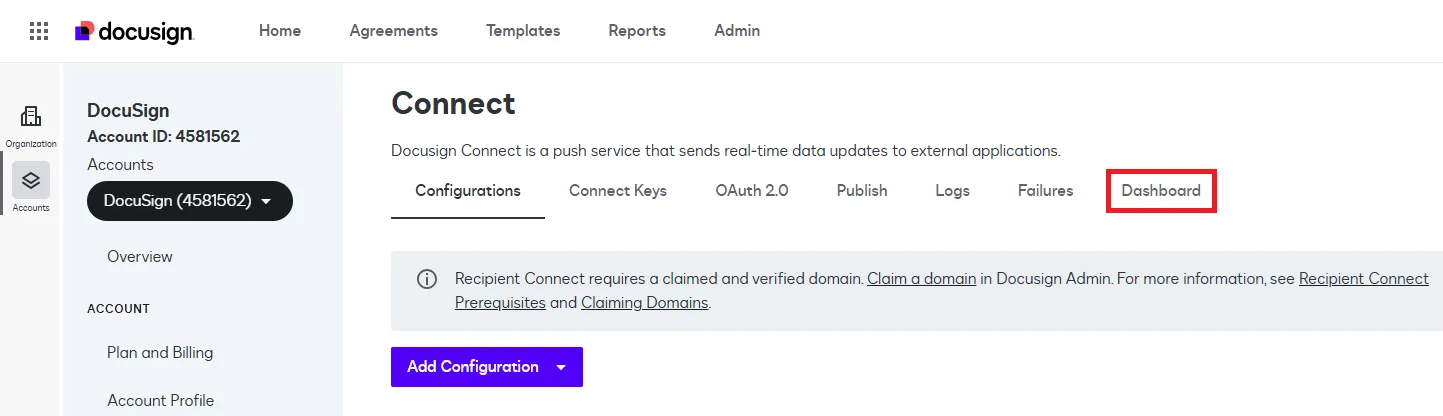
You can also view the Connect Dashboard by:
-
Open the Connect screen.
-
On the Connect screen, select DASHBOARD.
Using the Connect Dashboard
The Connect Dashboard displays metrics and information for your account’s Connect configurations. You can create and apply any number of filters that enable you to select and view exactly the set of Connect data that you want.
The Connect Dashboard displays metrics for a selected time period, with Last 30 days being the default.
Graph view
The graph view displays a graphical representation of your Connect event notifications, filtered in the way you choose. You can configure the display to:
-
View all, only successful, or only unsuccessful events
-
Group the results by:
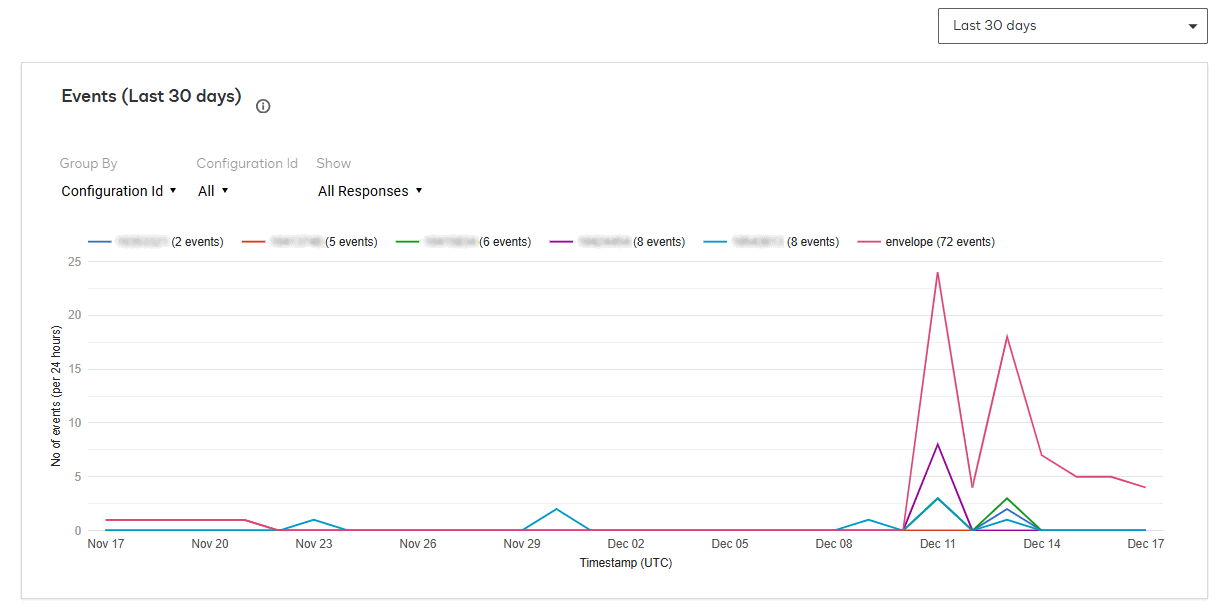
- Configuration ID (event response data for envelope-level Connect configurations will be displayed under an ID of “envelope”)
- Event
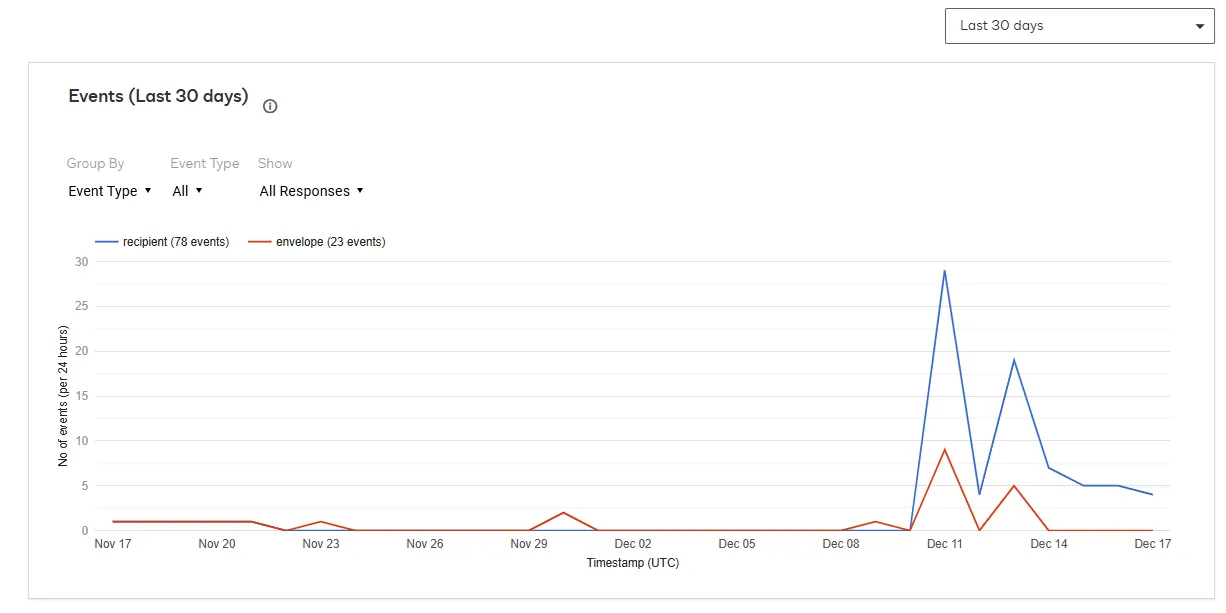
- Event type
-
Adjust the timeframe of the event metrics to be viewed from as recent as 2 hours to as far back as 90 days
For example, the following screenshot shows an Events graph query for all of your event notifications from the last 30 days, grouped by configuration ID.
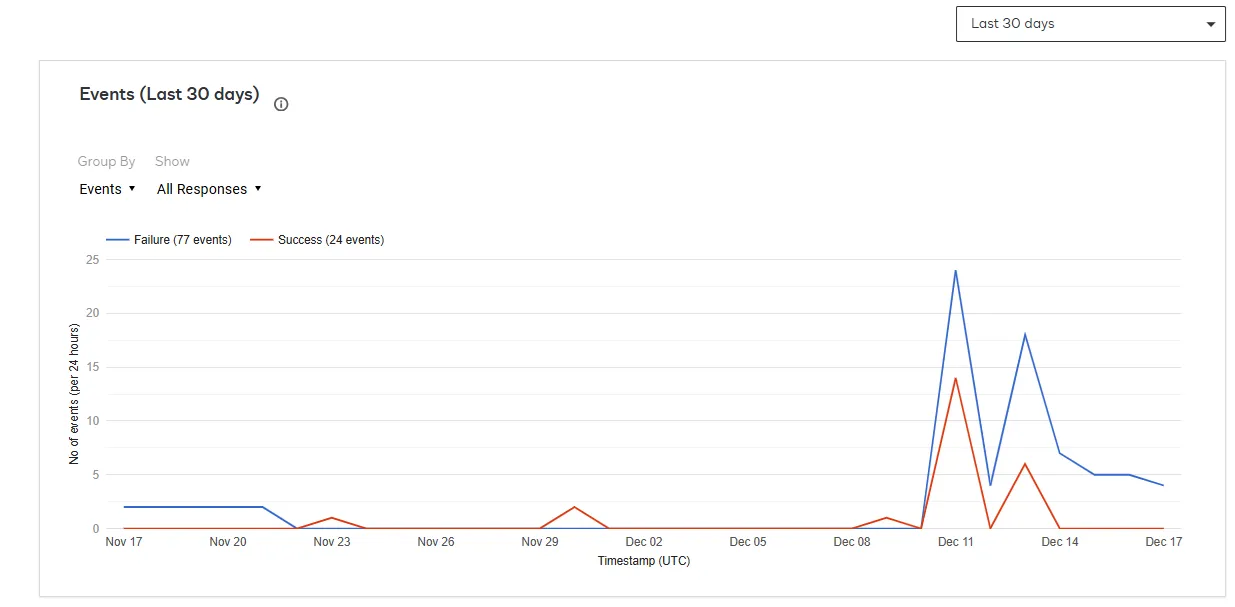
The following screenshot shows an Events query for all event notifications grouped by success or failure, helping you identify and troubleshoot failed events.
The following screenshot shows an Events query for all event notifications, grouped by event type. Grouping by event type can help you identify problems and troubleshoot why certain types of events may be failing.
Bookmarking groupings
If you have a specific set of groupings that you use often for important tasks, you can save them by setting them in the Connect Dashboard and then bookmarking the page. The URI of the Connect Dashboard will record your filter settings and, when you load your bookmark, the filters will also be loaded for you.
Connect events view
The Connect events view displays a list of the most recent 500 event notifications that meet your filter criteria. If your query returns more than 500 rows, set the parameters for your graph view’s Group by and Show tabs to narrow the set of results.
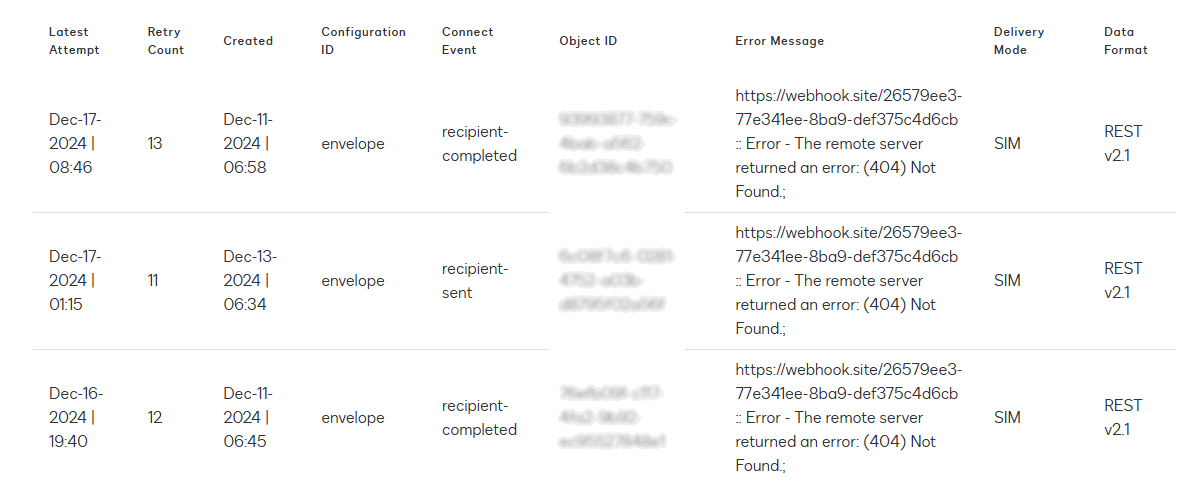
In cases where you are investigating unsuccessful Connect Events and resulting errors, you can use the Error Message field to help you troubleshoot.
The Dashboard displays information about the following fields for each recorded event response:
-
Latest Attempt: The date and time of the most recent event response of the specified type, object, delivery mode, and result for the configuration ID.
-
Retry Count: Indicates how many times you have attempted that operation without success. When an event fails multiple times, the instances of failure are combined into the retry count.
-
Created: The date and time of the first event response of the specified type, object, delivery mode, and result for the configuration ID.
-
Configuration ID: Identifies the Connect configuration that generated the event.
-
Connect Event: The type of event.
-
Object ID: The object identified by the value of Object ID in the response will depend on the event type.
- For recipients, object ID will refer to the envelope ID.
- For templates, object ID will refer to the template ID.
- For clickwraps, object ID will refer to the clickwrap ID.
-
Error Message: Holds the error message for a failed event response, or “Success”, if no error was returned. If Require Acknowledgement is unchecked or set to false in your account- or envelope-level Connect configuration, the Dashboard will not display any error data.
-
Delivery Mode: Indicates whether the message was delivered in Send Individual Message (SIM) or Aggregate mode.
-
Data Format: The data format of the event message. Connect configurations should use the JSON SIM event model whenever possible.