
API Dashboard overview
Try the new API Integrations Dashboard in the Developer Console to view realtime updates at the individual integration key level.
The API Dashboard enables developers to track the health of their Docusign integrations (apps), including API requests to the Docusign platform. The API Dashboard lets you track the health of your apps in several ways:
- Detailed reports of failed API requests so you can troubleshoot issues
- Graphical timeline of your successful and failed API requests for a given integration, up to the last 30 days
- Log of the specific API calls made for an integration, which can be filtered by time intervals and response codes or downloaded as a CSV file
- Details about failed requests that help you to investigate and troubleshoot
The API Dashboard shows all metrics and API requests made by your integrations, including those calls made through SDKs. This gives you a complete view of your Docusign integrations.
The API Dashboard reflects activity from these APIs:
Accessing the API Dashboard
The API Dashboard is available in both the developer (demo) account and production environments in the Apps and Keys page, using these links:
- Developer account environment
- Production environment
Use the button below to view the API Dashboard:
API DashboardYou can also view the API Dashboard in your Apps and Keys page by:
-
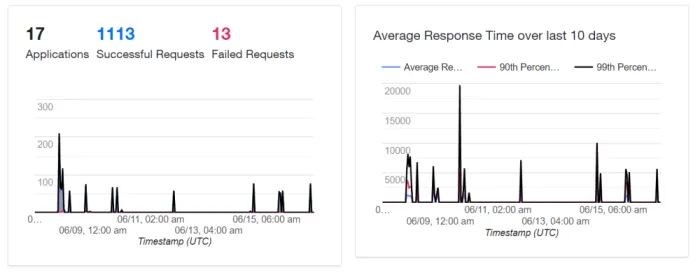
Scrolling down the API Dashboard tiles directly below your list of apps, then selecting one of the tiles.
-
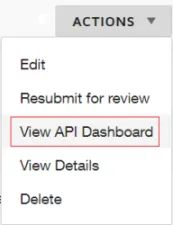
Selecting the Actions button for the integration key whose data you want to examine first, then choosing View API Dashboard.
Using the API Dashboard
The API Dashboard displays metrics and information for any of your account’s apps. You can create and apply any number of filters that enable you to select and view exactly the set of API call data that you want.
The API Dashboard displays metrics for a selected time period, with Last 30 days being the default, and is divided into these two tabs:
- API REQUEST VOLUME: The graph view of this tab helps you visualize and understand the overall health of your Docusign integration or to drill down and troubleshoot specific issues for an app.
- RESPONSE TIMES: The graph view of this tab shows the API response times for a filterable set of API calls over a period of time. You can use this tab to test and view exactly how responsive specific types of calls are, or detect possible performance and responsiveness problems with your app.
Within each tab, you can configure and display data in two ways:
- Graph view: Displays a graphical timeline of aggregated API request or response time data that meet your filter criteria.
- API calls view: Displays the 50 most recent API calls made to the Docusign platform that meet your filter criteria.
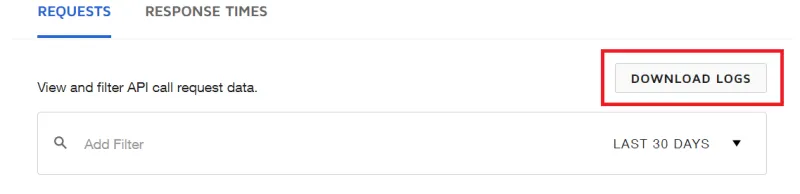
You can also download the log of all API calls from the last 30 days by selecting the DOWNLOAD LOGS button. The log data is stored as comma-separated values in the file and each API call log contains the same set of data fields as is shown in the API call view.
Filters
Filters enable you to view only the API call data that matches the criteria that you set. This helps you detect and debug problems by giving you options to show only the data you need for your tasks.
API Dashboard filters behave in the following ways:
- Multiple filters of different types (such as a filter for integration key combined with a filter for HTTP response code) are AND filters. Only API calls that match all filters are shown.
- Multiple filters of the same type (such as two filters for integration keys) are OR filters. All API calls that match either filter are shown.
For example, if you have set a filter for integration key = 8096fd09-xxxx-xxxx-xxxx-d84dff82b9d7 and Action = GetAccountInformation, Action = GetPlanType, you will be shown the data for all GetAccountInformation or GetPlanType API calls made by the 8096fd09-xxxx-xxxx-xxxx-d84dff82b9d7 integration key.
You can filter using the following categories:
- API action
- User ID (only for API REQUEST VOLUME)
- Account ID (only for API REQUEST VOLUME)
- Integration key
- Envelope ID
- HTTP response code (only for API REQUEST VOLUME; 400 is the only supported type of error code for filtering)
Bookmarking filters
If you have a specific set of filters and groupings that you use often for important tasks, you can save them by setting them in the API Dashboard and then bookmarking the page. The URI of the API Dashboard will record your filter settings and, when you load your bookmark, the filters will also be loaded for you.
Graph view
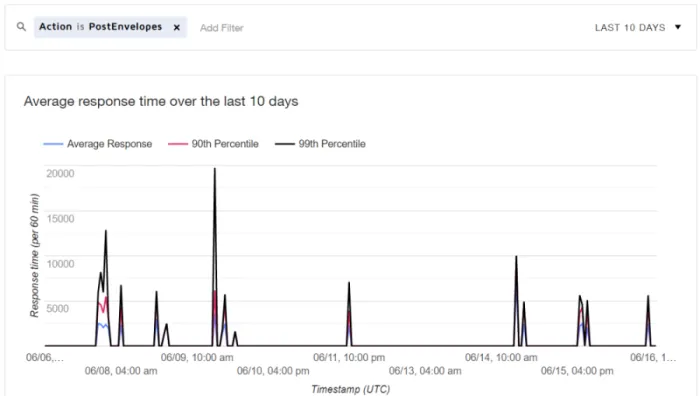
The graph view displays a graphical representation of your API requests or response times, grouped in the way you choose. You may choose to further customize the graphical representation to show a bar, line, or area graph, filter by successful or unsuccessful calls, and group the results by user ID, integration key, response type, or status code.
For example, the following screenshot shows a Response Times graph query for the response times of a specific type of API call, enabling you to determine the average time required for calls of that type to complete.
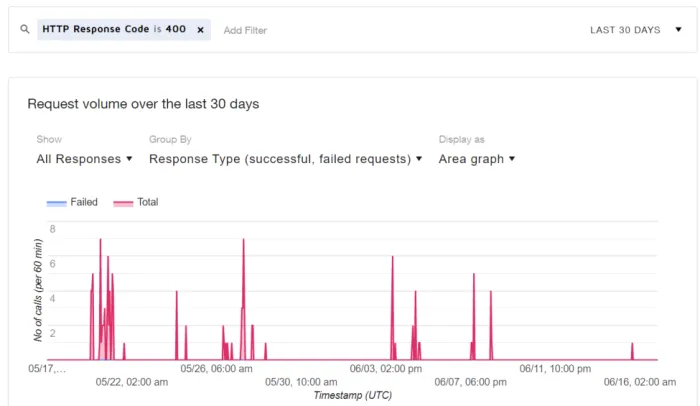
The following screen shows a Requests query for a specific error status code, helping you filter results and troubleshoot specific failed calls.
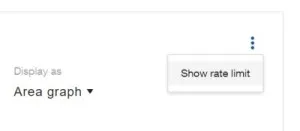
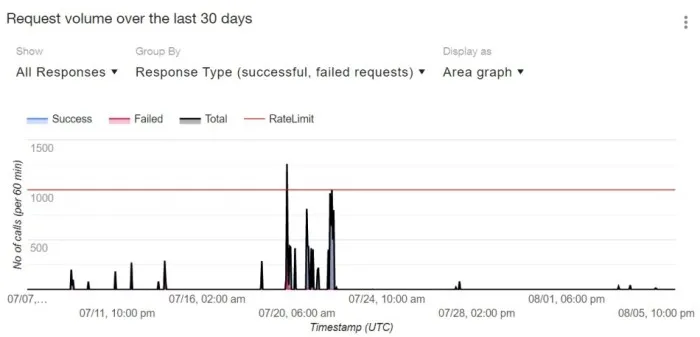
You can also enable a bar above the graph showing how close your account is to the calls per hour rate limit, which is 3,000 by default. To show the bar, select the three dots at the upper right of the graph, then choose Show rate limit.
The following image shows an example of the request volume graph with rate limit displayed.
API call view
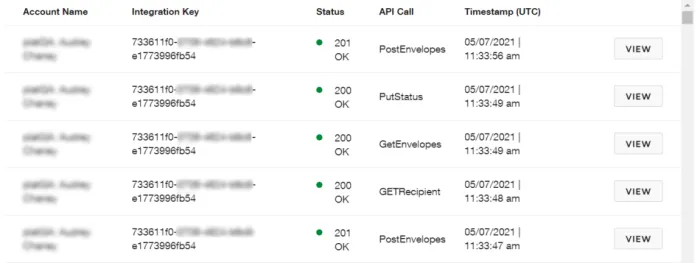
The API call view displays a list of the most recent 50 API calls that meet your filter criteria. You can select View for any call to see details about that call and its response.
In cases where you are investigating unsuccessful API calls and resulting errors, you can scroll to the bottom of the resulting window and use the Error Message and Error Code fields to help you troubleshoot. See the Error codes page for more information.
The dashboard displays information about the following fields for each recorded API call:
Application Details
- Timestamp: The Datetime when the call was made.
- Application: The Docusign API to which the call was made.
- Environment: Indicates the environment (developer or production) in which the call was made.
- Account Name: The name of your account.
- Account Id: Your account ID.
- Integration Key: The integration key that made the call.
- User Id: Your user ID.
API Call Details
- Action: The name of the called API method.
- Query String: Includes any query string used by the request.
- URL: The URL of the called API method.
- HTTP User Agent: The user agent that called the method.
Request / Response Details
- Request Method: The HTTP action of the called method.
- Http Response Status Code: The status code returned by the response.
- Envelope Id: The ID of the envelope associated with the request, if any.
- API Status: The status of the API request.
- API Elapsed Time: The number of milliseconds needed to execute the request.
- API Version: The version number of the API containing the called method.
- App Version: The version number of the calling app.
- Content Length: The size of the message body, in bytes.
- Error Message: Holds the message of the generated error, if any.
- Error Code: The generated error code, if any.
- Exception Message: Holds the message of the generated exception, if any.
- Duration: The total time required to execute the operation, including execution of any downstream methods.
- Request Start Time: The Datetime when the request was made.
- Request End Time: The Datetime when the request concluded.
- Response Content Length: The size of the response body, in bytes.
- Trace Token: A token linked to your session.
- Response Type: The type of response received, including a partial status code.
Walkthrough video
The following video walks through how to use the API Dashboard: